Empty Document Memory
July 28, 2017
My current project for work has got me diving deep into Chrome’s memory debugging tools. I’m grappling with GPU memory for work, but I’ve always wanted to better understand everything the memory section of the Performance panel, also known as the panel formerly known as Timeline.
Any production web page is going to have a lot going on in a performance profile, so it is important to be able to filter out the noise and see the things that are really important. This got me wondering…
What does the performance profile of an empty document look like?
So I created an empty file, memory.html, and then opened the file from my filesystem in a Chrome incognito window. /*// ⚠️ ⚠🔮 ️be smarter about these things */
I started a performance profile recording with the Memory checkbox checked,then reloaded the page manually and recorded for about 10 seconds. I couldn’t rely on the start profiling and reload option ⌘⇧E, because it stops recording before I wanted it to.
I expected to see a profile that looked something like this 👇.


But what I actually got looked like this 👇.


Get the profile here.
Okay, so actually, I understand where the flat tail at the end of that image is coming from, mostly.
Zoomed in on the tail, it looks like this 👇.


This is the memory profile after a major garbage collection 👆, which you can see if you get the profile and follow along.
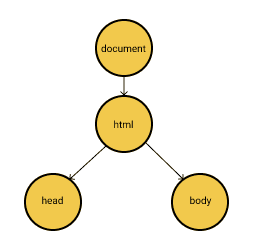
We’ve got 1 document, as expected.
We have 0 listeners, as expected.
We have 4 nodes, which Chrome will automatically generate for every HTML page:
document,html,head, andbody.

What I don’t understand about the tail is why we have any JavaScript heap at all 🤔. I should come back to that later.
My big question is this:
What are the other 4 documents and 71 nodes that are generated and then cleaned up after a few seconds?
This kind of thing is very difficult to Google.
So far, I really haven’t gotten anywhere with an answer to this.
Further research is needed.